


Where Skilled Talent Goes and Stays: The Best U.S. Metros for Attracting Talent
How America's largest metros attract, recruit and keep skilled workers
Key Takeaways
- The South is winning the competition for skilled talent
Southern metros take eight of the top 10 spots in our overall ranking. Raleigh, NC leads, followed by Austin, TX and Nashville, TN.
- Skilled talent flows both ways
About 1.36 million degree-holders moved into the study’s 53 metros from other states in one year, and about 1.4 million moved out.
- Depth and momentum rarely go together
San Jose has the deepest talent pool in the country but the least active local job market, while Las Vegas draws the most newcomers but has one of the thinnest skilled bases.
- The biggest markets compete on volume
Together, New York, Los Angeles, Chicago, and Washington, D.C. account for 28.4% of the study’s working-age degree-holders. Of the four, only D.C. pairs that size with strong talent attraction.
Skilled workers move between U.S. metros in large numbers. According to the most recent data, about 1.36 million adults with at least a bachelor’s degree moved into the 53 large U.S. metros in our study from another state. Meanwhile, employers in those same metros hired about 1.21 million degree-holders who were already working somewhere else (job-to-job hires).
For companies, the practical question is where that talent ends up and where it stays. To answer it, we looked at every U.S. metro with at least 1 million residents through five core metrics, each answering one question:
- How deep is the talent pool? The share of residents aged 25 to 64 with a bachelor’s degree or higher.
- Are educated adults moving in? College-educated residents who moved from another state in the past year, per 100 residents with a higher-education degree.
- Is the talent staying? College-educated residents who left for another state in the past year, per 100 educated residents.
- Are employers hiring from outside? Job-to-job hires of college-educated workers from outside the metro, per 1,000 educated workers employed.
- Can careers grow locally? Job-to-job moves of college-educated workers that happen entirely within the metro, per 1,000 educated workers employed.
Looking at the overall picture, midsize Southern metros are winning the competition for skilled workers, while many of the country’s deepest and most established talent pools are losing more skilled residents than they gain.
The Leading Metros: Raleigh, Austin, and Nashville Top a Southern-Heavy Ranking
Raleigh, Austin, and Nashville lead our ranking, but the top 10 didn’t all get there the same way. Below, we group the leaders by the formula behind their success, from all-around performers like Raleigh and Richmond to recruitment-driven Florida metros and newcomer magnets like Denver.
Leading the pack, Raleigh pairs one of the deepest talent pools in the country (53.7%) with the second-highest outside recruitment rate (105.6 hires per 1,000 skilled workers) and a below-median outflow rate. Anchored by NC State University and next door to Research Triangle Park, it also benefits from its neighbor: Durham–Chapel Hill is a separate metro area, so hiring across the Research Triangle counts as outside recruitment. Demand is keeping pace, too, as Raleigh’s degree-intensive employment grew 16.3% between 2022 and 2025, nearly twice the national rate of 8.8%.
Trailing close behind in second place, Austin follows a similar formula. It has the sixth-deepest talent pool in the study (52.3%), the third-highest outside recruitment rate (95.1), and the fastest-growing skilled base of any large metro except Fresno, with its working-age population of degree-holders up 32.8% over roughly five years. Home to the University of Texas and a tech cluster that includes Dell, Apple, and Tesla, the Texas capital is also creating the jobs to match: its degree-intensive employment rose 18.3% in three years.
Rounding out the top three, Nashville stands out on migration, drawing 3.8 educated newcomers from other states per 100 skilled residents. Its local job market is also one of the most active in the country, so newcomers have room to grow once they arrive. Healthcare (HCA Healthcare is headquartered there) and the music industry anchor the local economy.
When it comes to keeping talent, Richmond (#5) is the standout among the leaders. Only 1.9 educated residents per 100 left for another state, while newcomers arrived at an above-median rate of 3.0 per 100, for a net gain of 4,876. Virginia’s capital, home to the Federal Reserve Bank of Richmond and a major Capital One campus, also recruits actively from outside (84.9 hires per 1,000).
With Bank of America and Truist headquartered there, Charlotte (#6) — the country’s second-largest banking center — has the seventh-highest outside recruitment rate (86.6) and an above-median local job market. What’s more, Charlotte and Raleigh post the two biggest net gains in the study from job moves across metro lines: their employers hired 2,194 and 2,249 more skilled workers, respectively, from outside the metro than they lost to employers elsewhere.
Florida’s two entries in the top 10, Jacksonville (#4) and Tampa (#8), take a different route. Both have talent pools thinner than the median (37.1% each), but their employers recruit aggressively from outside. Jacksonville has the highest outside recruitment rate in the study (105.9 per 1,000), backed by employers in financial services (FIS), logistics (CSX), and healthcare (Mayo Clinic). Tampa ranks fifth (93.4) and is also one of the most entrepreneurial metros in the country, with 55.1 business applications per 1,000 working-age residents, second only to Miami.
The rest of the top 10 follows yet another formula. Denver (#7), Washington, D.C. (#9), and Kansas City (#10) all pair above-median talent pools with strong inflows of educated newcomers (3.5 to 4.1 per 100 skilled residents) and active local job markets. However, their employers recruit from outside less often than the leaders, and their degree-holders are more likely than those in the typical metro to leave for other states. In Denver and Kansas City, newcomers more than make up for those departures, while D.C. ends up with a net loss.
Of the three, Denver, which combines an outdoor lifestyle with sizable aerospace and tech sectors, is also one of the most entrepreneurial metros in the country, with 47.6 business applications per 1,000 working-age residents. Kansas City, home to Garmin, H&R Block, and a large engineering cluster, has the fourth-most active local job market in the study. We take a closer look at D.C. in the section on the biggest markets.
The leaders also tend to be affordable places to hire. Four of the top 10 (Nashville at $70,193, Richmond at $69,088, Jacksonville at $66,038, and Tampa at $65,401) pay bachelor’s degree holders a median below the national figure of $70,470, and those four plus Kansas City also fall below the national median for graduate degree holders ($90,191).
The Big Picture: Skilled Talent Is on the Move, and the South Is Winning
Skilled talent moves constantly, and in both directions. Across the 53 metros, about 1.36 million degree-holders arrived from other states in a single year, while about 1.4 million left. Job-to-job data shows the same balance: employers hired 1.21 million degree-holders from outside their metros, and 1.23 million skilled workers left for jobs elsewhere. Even more job changes happened close to home, with about 1.85 million moves between employers within the same metro.
Because arrivals and departures tend to rise and fall together, the busiest talent markets are often the ones that gain and lose the most. Washington, D.C. is the clearest example: nearly 100,000 degree-holders moved in from other states, and more than 104,000 moved out. That kind of two-way traffic is a sign of an active, well-connected market, which is why our study looks at both directions rather than just the net result. Retention, meanwhile, looks much the same across the country, with average outflow rates between 2.6 and 2.8 departures per 100 skilled residents in every region.
Where talent settles, however, follows a clear pattern when we group the study’s metros by region, and it’s the same one behind the South’s hold on our top 10.
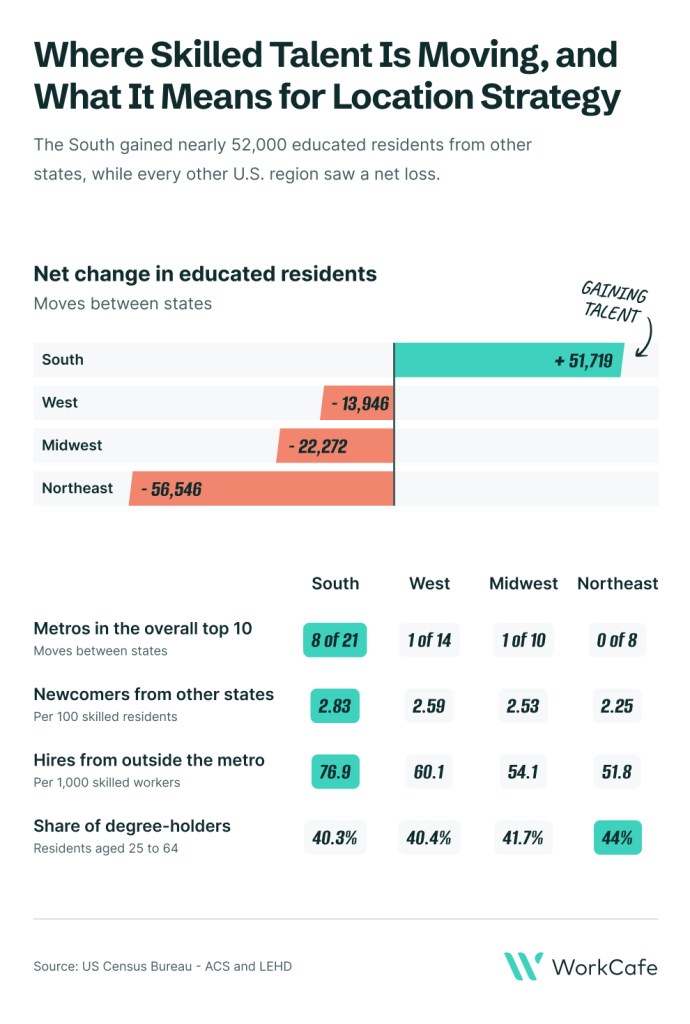
Interestingly, the South’s lead has little to do with depth. Its metros actually have the lowest average share of degree-holders of the four regions. Where Southern metros pull ahead is movement. They draw about 25% more educated newcomers per resident than Northeastern metros, and their employers recruit from outside at a rate roughly 50% higher. In fact, the eight metros with the highest outside recruitment rates in the study are all in the South.
The Northeast shows the opposite profile: the deepest talent pools on average, but the lowest rates of newcomers and outside recruitment, along with a combined net loss of more than 56,500 educated residents (about 39,200 of them from New York alone). The Midwest stands out for local opportunity, with the most active local job markets of any region, at an average of 87.6 job changes per 1,000 skilled workers. And the West is the most mixed. Phoenix, Seattle, Las Vegas, Portland, Salt Lake City, and Denver all gained educated residents, while all seven California metros in the study posted net losses.
The Deepest Talent Pools Aren’t Always the Most Active Hiring Markets
Outside the leaders, most metros excel on some measures and lag on others. In fact, how many educated people move to a metro has virtually no relationship with how actively its employers recruit from outside. Those mismatches reveal very different kinds of talent markets.
The country’s deepest talent pools tend to be its most settled. San Jose has the highest share of degree-holders in the country (58.7%), followed by Washington, D.C. (56.1%), San Francisco (55.7%), and Boston (55.6%). These metros also have the most jobs that require a degree (45.1% of private-sector jobs in San Jose, compared to 30.5% nationally) and the highest salaries. Bachelor’s degree holders in San Jose earn a median of $103,074, and graduate degree holders earn $170,039, ahead of San Francisco ($101,441 and $141,568) and Seattle ($91,248 and $121,950).
What these pools don’t do is move much. San Jose draws just 1.7 educated newcomers per 100 skilled residents and has the least active local job market of all 53 metros, which leaves it at #14 overall. The talent behind companies like Apple, Google, and Nvidia is there, but it appears to stay put with its current employers. San Francisco (tied for #19) and Boston (#29) follow a similar pattern, and both lost more educated residents to other states than they gained (8,688 and 7,745, respectively). The five least active local job markets in the study are all in California, partly because regions like the Bay Area are split into several metro areas, so a move from San Francisco to San Jose counts as an outside hire rather than a local one.
At the other end of the spectrum are metros where people move in faster than employers recruit. Las Vegas has the highest inflow of educated newcomers in the study (4.9 per 100 skilled residents) but ranks 46th for outside recruitment and has the lowest share of jobs that typically require a degree (20.6%). That suggests lifestyle, relative affordability, and the absence of a state income tax are driving migration more than employer demand, which leaves Las Vegas at #30 overall. Still, newcomers seem to find work once they arrive: Las Vegas has the second-most active local job market in the study (120.5 job changes per 1,000 skilled workers), behind only Phoenix (124.8). Seattle, Denver, and Kansas City show milder versions of the same pattern, although Denver and Kansas City pair it with enough depth to make the top 10.
A third group recruits little from outside because it doesn’t need to. New York (24.2 hires per 1,000), Minneapolis (27.1), Chicago (28.0), and Boston (34.2) have the lowest outside recruitment rates in the study, which says more about how careers work there than about a lack of opportunity. Skilled workers often advance inside large institutions, such as banks, universities, hospital systems, and corporate headquarters, and those promotions don’t count as job changes in the data. New York, Minneapolis, and Chicago also have some of the most active local job markets in the study. Similarly, Atlanta (#13) ranks third for local job changes but 45th for outside recruitment, as the headquarters of Delta, Coca-Cola, and Home Depot give skilled workers plenty of options without leaving town.
Finally, low outflow rates need some context. Sacramento, Fresno, and Houston have the lowest outflow rates in the study (1.3 to 1.4 per 100), but they also draw relatively few newcomers. That’s partly a measurement effect: California and Texas are so large that moves between their own metros never cross a state line, so they don’t show up in interstate data.
New York, LA, Chicago, and D.C. Offer Unmatched Scale, but Most Hiring Stays Local
Because our core metrics are rates, they naturally favor midsize metros. A metro with 400,000 degree-holders needs only a few thousand newcomers to post a high inflow rate, whereas one with 5 million needs tens of thousands. On rates alone, three of the four largest talent markets land near the bottom of our ranking: New York (#48), Chicago (#49), and Los Angeles (#50). Judged by volume, however, they’re in a league of their own. Together with Washington, D.C., they’re home to 11.9 million working-age degree-holders, or 28.4% of the total across all 53 metros.
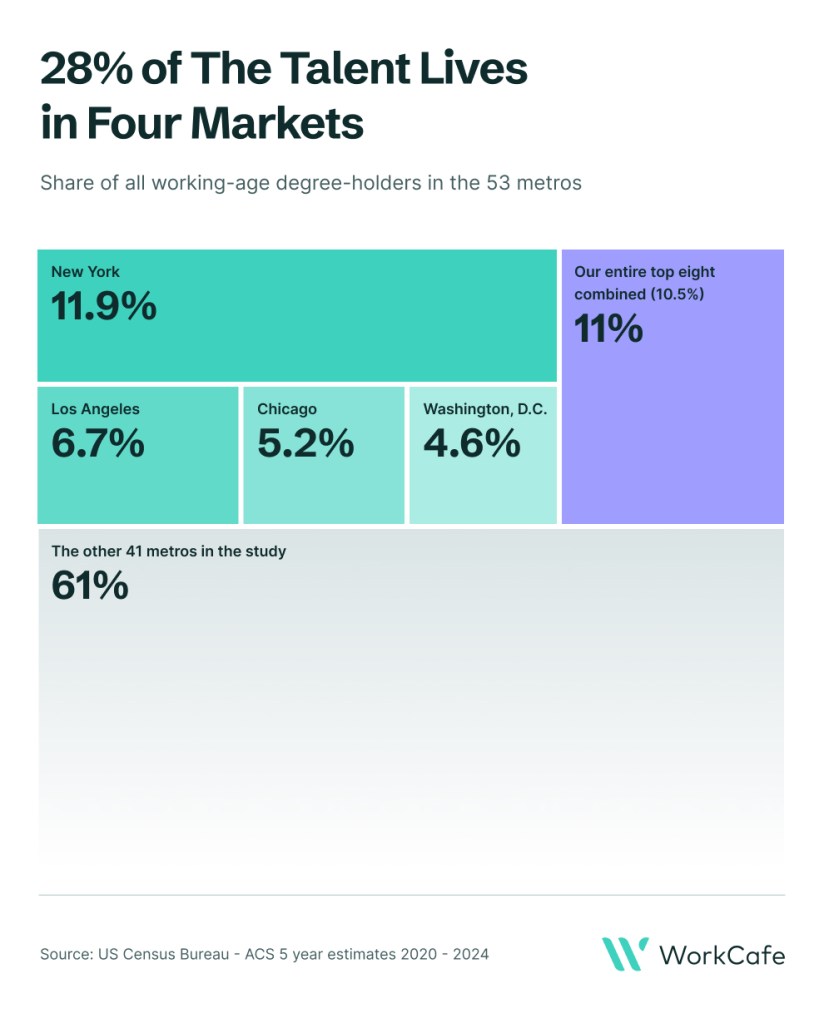
New York’s five million working-age degree-holders outnumber those of Raleigh, Austin, Nashville, Jacksonville, Richmond, Charlotte, Denver, and Tampa combined. Even with the lowest outside recruitment rate in the study, its employers hired more skilled workers from outside the metro (70,471) than employers in any other metro. Its 278,989 local job changes also exceed the entire educated working-age population of Salt Lake City. Los Angeles and Chicago follow a similar pattern, with large internal markets doing most of the work. As a group, the four metros account for 30.8% of all local job changes in the study but only 17.5% of hires from outside.
Washington, D.C. is the exception, combining scale with high rates to earn the #9 spot. Still, there are early signs of cooling: degree-intensive employment dipped 0.7% between 2022 and 2025, and its talent pool grew 7.2% over roughly five years, compared to 13.4% nationally. Since the data only partly reflects the federal workforce cuts that began in 2025, D.C. will be worth watching in the coming years.
Employers in Providence, Fresno, and Orlando Are Adding Degree-Level Jobs the Fastest
Our ranking measures the supply and movement of skilled talent, but employer demand completes the picture. Nationally, jobs that typically require a bachelor’s degree make up 30.5% of private employment, and their number grew 8.8% between 2022 and 2025.
The fastest growth came from Providence (31.3%), Fresno (27.3%), Orlando (18.5%), Austin (18.3%), and Raleigh (16.3%). In Austin and Raleigh, demand is rising alongside strong talent attraction. In Providence (#43) and Fresno (#51), it appears to be running ahead of it. Fresno, for instance, has the thinnest skilled base in the study (23.4%) but also the fastest-growing one, with its working-age population of degree-holders up 34.1%. On the other hand, degree-intensive employment shrank in Portland, Memphis, San Francisco, and Washington, D.C.
New business activity tracks talent attraction more closely. Miami leads the country with 75.4 business applications per 1,000 working-age residents, more than twice the national rate of 32.5. Tampa (55.1), Atlanta (52.7), Orlando (51.6), and Denver (47.6) follow, and all four rank in our overall top 15. Miami (#37) is the exception: despite leading on new business activity, it has a below-median talent concentration and draws relatively few educated newcomers from other states.
Methodology
- Geography: We analyzed U.S. metropolitan statistical areas (MSAs) with a total population of at least 1 million and complete data across all five core metrics, for a total of 53 metros. Detroit was excluded because job-to-job flow data for Michigan is not available.
- Educated talent definition: People with a bachelor’s degree or higher (bachelor’s, master’s, or doctoral or professional degree).
- Core metrics:
- Educated Talent Concentration: Population aged 25–64 with a bachelor’s degree or higher, as a share of the total population aged 25–64.
Source: U.S. Census Bureau, ACS 5-year estimates, 2020–2024 (S1501)
- Interstate Educated Inflow Rate: Residents aged 25+ with a bachelor’s degree or higher who lived in a different state one year earlier, per 100 educated residents aged 25+.
Source: U.S. Census Bureau, ACS 1-year estimates, 2024 (B07009)
- Interstate Educated Outflow Rate: Former residents aged 25+ with a bachelor’s degree or higher who moved to a different state, per 100 educated residents aged 25+ one year earlier.
Source: U.S. Census Bureau, ACS 1-year estimates, 2024 (B07409)
- J2J External Recruitment Rate: Employer-to-employer hires of workers with a bachelor’s degree or higher from outside the metro area (with a short or no unemployment spell, all industries), summed over four quarters (Q3 2024 – Q2 2025), per 1,000 educated workers employed. Geography reflects the employer’s location, not the worker’s residence. Data not available for MI and AK
Source: U.S. Census Bureau, LEHD Job-to-Job Flows (R2026Q2), accessed via the LED Extraction Tool on August 11, 2026 https://ledextract.ces.census.gov
- J2J Local Market Depth: Employer changes of workers with a bachelor’s degree or higher where both the origin and destination are within the metro, summed over four quarters (Q3 2024 – Q2 2025), per 1,000 educated workers employed. Source: U.S. Census Bureau, LEHD Job-to-Job Flows (R2026Q2), accessed via the LED Extraction Tool on August 11, 2026 https://ledextract.ces.census.gov
- Overall ranking: To compare metros overall, we combined the five core metrics into a weighted ranking:
- Educated Talent Concentration (25%)
- Interstate Educated Inflow Rate (20%)
- Interstate Educated Outflow Rate (15%, lower is better)
- J2J External Recruitment Rate (25%)
- J2J Local Market Depth (15%)
- Metros with tied results share the same rank.
Context metrics:
- Median earnings of workers aged 25+ with a bachelor’s degree and with a graduate or professional degree.
Source: U.S. Census Bureau, ACS 1-year estimates, 2024 (B20004)
- Degree-intensive employment: the share of total private employment in occupations that typically require a bachelor’s degree or higher for entry, plus its change between 2022 and 2025.
Sources: Bureau of Labor Statistics, Occupational Employment and Wage Statistics (OEWS) 2022 and 2025; BLS Employment Projections, Table 5.4 (2025)
- Business applications intensity: total business applications per 1,000 residents aged 25–64.
Sources: U.S. Census Bureau, Business Formation Statistics, annual county data 2025; ACS 1-year estimates, 2024
- Talent stock growth: change in the population aged 25–64 with a bachelor’s degree or higher between the 2015–2019 and 2020–2024 ACS 5-year periods.
- Net interstate and net job-to-job balances, calculated from the corresponding inflow and outflow figures.
- Analysis notes:
- Medians are calculated across all 53 metros.
- Regions follow U.S. Census Bureau definitions, based on each metro’s principal state.
- Regional figures are simple averages of metro values, except for the net change in educated residents, which is a regional total.

Andreea Neculae
View more from
Andreea